Understanding Change Rate
Change rate is the amount of data that changes in your environment daily. If you have 900GB of data, and 15% of that changes daily, then you have a change rate of 135GB per day. Industry averages vary, but most experts say that the average file server will see a daily change rate of 5% - 10%, while database servers will likely be as high as 35%.
Every network is different. To determine your change rate, look at your current backup system. A differential backup shows you the exact amount of data that’s changed since the last backup.

Available Bandwidth
Once you have a sense of your change rate, you need to consider available bandwidth. The operative word here is available. For example, if you have a 20Mb/s internet circuit that’s 50% used during the day, then you have 10Mb/s of bandwidth available for replication during business hours. Once the work day ends, that could climb to as much as 90% of the total circuit speed giving you 18Mb/s to use for replication during the overnight hours.
With Live Replication, your primary concern will be bandwidth available during business hours.
With Scheduled Replication, you will be primarily concerned with bandwidth available during off-hours.
Most people work backwards. They start by understanding their change rate and then go from there. For example, let’s assume you have a total data volume of 800GB with change rate of 4% (32GB changes per day). You want to do a Scheduled Replication during off-hours and have a window of 10 hours to complete the replication. That means you need to move 3.2GB per hour. Converting that to Mb/s,you need a circuit that has available bandwidth of about 7.6Mb/s. In other words, the 20Mbps circuit mentioned above will be more than enough for Scheduled Replication.

Other factors that will impact the performance of your replication may include your internet provider’s latency, any data de-duplication, and any compression occurring.
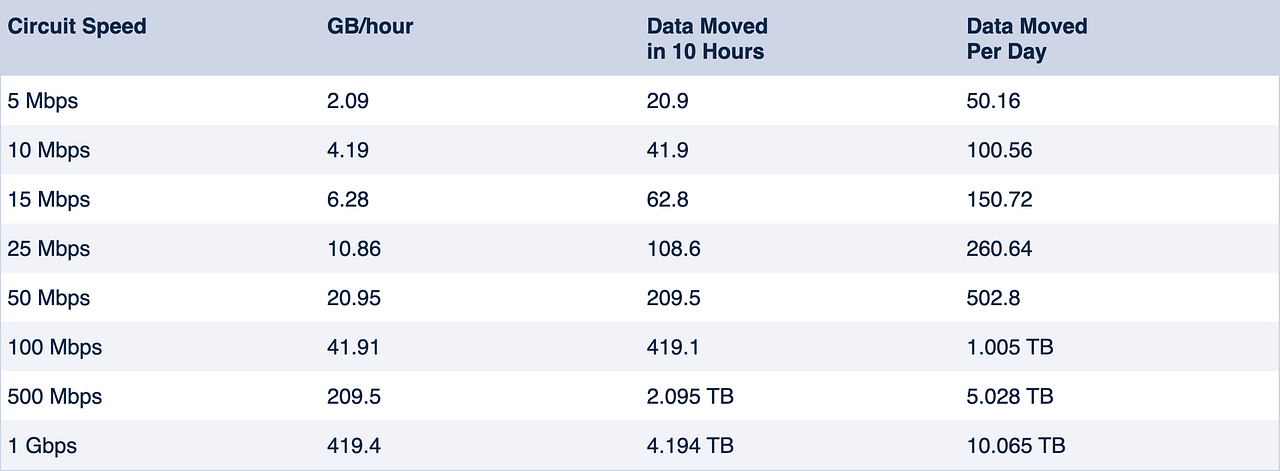
As a starting point, we present the following bandwidth conversion chart to the left. It will help you understand the amount of data that can be transferred at various internet circuit speeds when considering an overnight window or a full day.


